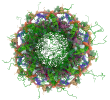
Model quality ?
For models with atomic structures, MolProbity analysis is performed. For models with coarse-grained or multi-scale structures, excluded volume analysis is performed.
Standard geometry: bond outliers ?
There are no bond length outliers.Standard geometry: angle outliers ?
There are no bond angle outliers.Too-close contacts ?
The following all-atom clashscore is based on a MolProbity analysis. All-atom clashscore is defined as the number of clashes found per 1000 atoms (including hydrogen atoms). The table below contains clashscores for all atomic models in this entry.
| Model ID | Clash score | Number of clashes |
|---|---|---|
|
1
|
2.17
|
2
|
|
2
|
5.43
|
5
|
|
3
|
0.00
|
0
|
|
4
|
2.17
|
2
|
|
5
|
0.00
|
0
|
|
6
|
1.09
|
1
|
|
7
|
2.17
|
2
|
|
8
|
0.00
|
0
|
|
9
|
0.00
|
0
|
|
10
|
0.00
|
0
|
There are 12 clashes. The table below contains the detailed list of all clashes based on a MolProbity analysis. Bad clashes are >= 0.4 Angstrom.
| Atom 1 | Atom 2 | Clash(Å) | Model ID (Worst) | Models (Total) |
|---|---|---|---|---|
|
A:9:LEU:O
|
A:9:LEU:HD23
|
0.71
|
2
|
1
|
|
A:9:LEU:C
|
A:9:LEU:HD23
|
0.62
|
2
|
1
|
|
A:50:LEU:O
|
A:50:LEU:HD23
|
0.60
|
4
|
4
|
|
A:50:LEU:C
|
A:50:LEU:HD23
|
0.59
|
4
|
5
|
|
A:9:LEU:C
|
A:9:LEU:CD2
|
0.47
|
2
|
1
|
Torsion angles: Protein backbone ?
In the following table, Ramachandran outliers are listed. The Analysed column shows the number of residues for which the backbone conformation was analysed.
| Model ID | Analysed | Favored | Allowed | Outliers |
|---|---|---|---|---|
|
1
|
54
|
54
|
0
|
0
|
|
2
|
54
|
54
|
0
|
0
|
|
3
|
54
|
54
|
0
|
0
|
|
4
|
54
|
54
|
0
|
0
|
|
5
|
54
|
54
|
0
|
0
|
|
6
|
54
|
53
|
1
|
0
|
|
7
|
54
|
54
|
0
|
0
|
|
8
|
54
|
54
|
0
|
0
|
|
9
|
54
|
54
|
0
|
0
|
|
10
|
54
|
54
|
0
|
0
|
Torsion angles : Protein sidechains ?
In the following table, sidechain rotameric outliers are listed. The Analysed column shows the number of residues for which the sidechain conformation was analysed.| Model ID | Analysed | Favored | Allowed | Outliers |
|---|---|---|---|---|
|
1
|
46
|
46
|
0
|
0
|
|
2
|
46
|
45
|
1
|
0
|
|
3
|
46
|
46
|
0
|
0
|
|
4
|
46
|
46
|
0
|
0
|
|
5
|
46
|
46
|
0
|
0
|
|
6
|
46
|
45
|
1
|
0
|
|
7
|
46
|
46
|
0
|
0
|
|
8
|
46
|
46
|
0
|
0
|
|
9
|
46
|
46
|
0
|
0
|
|
10
|
46
|
45
|
1
|
0
|
