3.2. Crosslinking-MS
At the moment, data validation is only available for crosslinking-MS data deposited as a fully compliant dataset in the PRIDE Crosslinking database. Correspondence between crosslinking-MS and entry entities is established using pyHMMER. Only residue pairs that passed the reported threshold are used for the analysis. The values in the report have to be interpreted in the context of the experiment (i.e. only a minor fraction of in-situ or in-vivo dataset can be used for modeling).
Crosslinking-MS dataset is not available in the PRIDE Crosslinking database.
3.3. 3DEM ?
This section describes quality of the 3DEM datasets
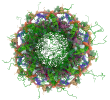
EMD-4970
3.3.1. Experimental information ?
| EM reconstruction method: | SINGLE PARTICLE | |||
| Resolution: | 3.50 Å | |||
| Recommended level: | 0.015 | |||
| Estimated volume: | 131.36 nm³ | |||
| Specimen preparation: |
|
|||
| Map-only validation report: | wwPDB validation report |
3.3.2. Map visualisation ?
This section contains visualisations of the EMDB entry EMD-4970. These allow visual inspection of the internal detail of the map and identification of artifacts. Images derived from a raw map, generated by summing the deposited half-maps, are presented below the corresponding image components of the primary map to allow further visual inspection and comparison with those of the primary map.
3.3.2.1. Orthogonal projections ?
Primary map

|

|

|
| X | Y | Z |
The images above show the map projected in three orthogonal directions.
3.3.2.2. Central slices ?
Primary map

|

|

|
| X Index: 160 | Y Index: 160 | Z Index: 160 |
The images above show central slices of the map in three orthogonal directions.
3.3.2.3. Largest variance slices ?
Primary map

|

|

|
| X Index: 153 | Y Index: 134 | Z Index: 166 |
The images above show the largest variance slices of the map in three orthogonal directions.
3.3.2.4 Orthogonal standard-deviation projections (false-color) ?
Primary map

|

|

|
| X | Y | Z |
The images above show the map standard deviation projections with false color in three orthogonal directions. Minimum values are shown in green, max in blue, and dark to light orange shades represent small to large values respectively.
3.3.2.5. Orthogonal surface views ?
Primary map

|

|

|
| X | Y | Z |
The images above show the 3D surface view of the map at the recommended contour level 0.015 . These images, in conjunction with the slice images, may facilitate assessment of whether an appropriate contour level has been provided.
3.3.2.6. Mask visualisation ?
This section shows the 3D surface view of the primary map at 50% transparency overlaid with the specified mask at 0% transparency. A mask typically either:
- Encompasses the whole structure;
- Separates out a domain, a functional unit, a monomer or an area of interest from a larger structure.
emd_4970_msk_1.map ?

|

|

|
| X | Y | Z |
3.3.3. Map analysis ?
This section contains the results of statistical analysis of the map.3.3.3.1. Map-value distribution ?
The map-value distribution is plotted in 128 intervals along the x-axis. The y-axis is logarithmic. A spike in this graph at zero usually indicates that the volume has been masked.
3.3.3.2. Volume estimate ?
The volume at the recommended contour level is 131.36 nm³.
The volume estimate graph shows how the enclosed volume varies with the contour level. The recommended contour level is shown as a vertical line and the intersection between the line and the curve gives the volume of the enclosed surface at the given level.
3.3.3.3. Rotationally averaged power spectrum ?
*Reported resolution corresponds to spatial frequency of 0.286 Å⁻¹
3.3.4. Fourier-Shell correlation ?
3.3.4.2. Resolution estimates ?
| Resolution estimate (Å) | Estimation criterion (FSC cut-off) | ||
|---|---|---|---|
| 0.143 | 0.5 | Half-bit | |
| Reported by author | 3.50 | - | - |
Author-provided FSC curve is not available.