5.2. Crosslinking-MS ?
5.2.1. Restraint types ?
This table summarizes information about crosslinker(s) used for data generation, and how crosslinking information was translated into actual modeling restraints. Restraints assigned "by-residue" are interpreted as between CA atoms. Restraints between coarse-grained beads are indicated as "coarse-grained". Restraint group represents a set of crosslinking restraints applied collectively in the modeling.
There are 21 crosslinking restraints combined in 21 restraint groups.
| Linker | Residue 1 | Atom 1 | Residue 2 | Atom 2 | Restraint type | Distance, Å | Count |
|---|---|---|---|---|---|---|---|
| BS3 | ALA | CA | GLY | CA | upper bound | 30.00 | 1 |
| BS3 | ALA | CA | LEU | CA | upper bound | 30.00 | 2 |
| BS3 | ASP | CA | GLU | CA | upper bound | 30.00 | 2 |
| BS3 | GLU | CA | LEU | CA | upper bound | 30.00 | 4 |
| BS3 | ASP | CA | PHE | CA | upper bound | 30.00 | 1 |
| BS3 | GLY | CA | PHE | CA | upper bound | 30.00 | 1 |
| BS3 | ARG | CA | PHE | CA | upper bound | 30.00 | 1 |
| BS3 | LEU | CA | PHE | CA | upper bound | 30.00 | 1 |
| BS3 | ARG | CA | GLU | CA | upper bound | 30.00 | 1 |
| BS3 | LEU | CA | SER | CA | upper bound | 30.00 | 1 |
| BS3 | ASP | CA | GLN | CA | upper bound | 30.00 | 1 |
| BS3 | ASP | CA | LEU | CA | upper bound | 30.00 | 1 |
| BS3 | LEU | CA | LEU | CA | upper bound | 30.00 | 2 |
| BS3 | ARG | CA | ASP | CA | upper bound | 30.00 | 1 |
| BS3 | GLN | CA | LEU | CA | upper bound | 30.00 | 1 |
Distograms of individual restraints
Distograms (i.e., histogram plots of distances) provide an overview of distributions of distances between residues for which chemical crosslinks were identified. The shift of the distogram relative to the threshold value may indicate a poor model. Restraints with identical thresholds are grouped into one plot. Only the best distance per restraint per model group/ensemble is plotted. Inter- and intramolecular (including self-links) restraints are also grouped into one plot. Distance for a restraint between coarse-grained beads is calculated as a minimal distance between shells; if beads intersect, the distance will be reported as 0.0. A bead with the highest available resolution for a given residue is used for the assessment.
5.2.2. Satisfaction of restraints ?
Satisfaction of restraints is calculated on a restraint group (a set of crosslinking restraints applied collectively in the modeling) level. Satisfaction of a restraint group depends on satisfaction of individual restraints in the group and the conditionality (all/any). A restraint group is considered satisfied, if the condition was met in at least one model of the model group/ensemble. The number of measured restraints can be smaller than the total number of restraint groups if crosslinks involve non-modeled residues. Only deposited models are used for validation right now.
| State group | State | Model group | # of Deposited models/Total | Restraint group type | Satisfied (%) | Violated (%) | Count (Total=21) |
|---|---|---|---|---|---|---|---|
| 1 | 1 | 1 | 1/1 | All | 33.33 | 66.67 | 21 |
| Heteromeric links/ Intermolecular |
33.33 | 66.67 | 21 |
Per-model satisfaction rates in model groups/ensembles
Every point represents one model in a model group/ensemble. Where possible, boxplots with quartile marks are also plotted.
5.3. 3DEM
This section describes fit of models to the 3DEM data. Only results for the representative model, selected as a first model with the largest number of asymmetric units.
EMD-4970
5.3.1. Map-model fit ?
Only results for the representative Model 1 are shown.5.3.1.1 Map-model overlay ?

|

|

|
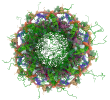
| X | Y | Z |
The images above show the 3D surface view of the map at the recommended contour level 0.015 at 50% transparency in yellow overlaid with a ribbon representation of the model colored in blue. These images allow for the visual assessment of the quality of fit between the atomic model and the map.
5.3.1.2. Q-score mapped to coordinate model ?

|

|

|

|
| X | Y | Z |
The images above show the model with each residue colored according to its Q-score. This shows their resolvability in the map with higher Q-score values reflecting better resolvability. Please note: Q-score is calculating the resolvability of atoms, and thus high values are only expected at resolutions at which atoms can be resolved. Low Q-score values may therefore be expected for many entries.
5.3.1.3. Atom inclusion mapped to coordinate model ?

|

|

|

|
| X | Y | Z |
The images above show the model with each residue colored according to its atom inclusion. This shows to what extent they are inside the map at the recommended contour level 0.015 .
5.3.1.4. Atom inclusion ?
At the recommended contour level, 44% of all backbone atoms, 38% of all non-hydrogen atoms, are inside the map.
5.3.1.5. Map-model fit summary ?
The table lists the average atom inclusion at the recommended contour level ( 0.015 ) and Q-score for the entire model and for each chain.
| Chain | Atom inclusion | Q-score |
|---|---|---|
| All | 0.378 | 0.234 |
| A | 0.734 | 0.450 |
| B | 0.671 | 0.398 |
| C | 0.624 | 0.389 |
| D | 0.578 | 0.378 |
| E | 0.604 | 0.392 |
| F | 0.648 | 0.418 |
| G | 0.207 | 0.157 |
| H | 0.301 | 0.212 |
| I | 0.049 | 0.040 |
| J | 0.009 | -0.019 |
| K | 0.004 | -0.006 |
| L | 0.005 | 0.007 |
| M | 0.000 | 0.012 |
| N | 0.000 | -0.015 |
| O | 0.274 | 0.144 |
| P | 0.298 | 0.147 |
| Q | 0.875 | 0.382 |
| R | 1.000 | 0.528 |
| S | 1.000 | 0.556 |
| T | 1.000 | 0.532 |
| U | 1.000 | 0.580 |
| V | 1.000 | 0.570 |
| W | 1.000 | 0.101 |
| X | 0.000 | 0.090 |
| Y | 0.000 | -0.028 |
| Z | 0.000 | 0.474 |