Crosslinking-MS
At the moment, data validation is only available for crosslinking-MS data deposited as a fully compliant dataset in the PRIDE Crosslinking database. Correspondence between crosslinking-MS and entry entities is established using pyHMMER. Only residue pairs that passed the reported threshold are used for the analysis. The values in the report have to be interpreted in the context of the experiment (i.e. only a minor fraction of in-situ or in-vivo dataset can be used for modeling).
Crosslinking-MS dataset is not available in the PRIDE Crosslinking database.
3DEM
This section describes quality of the 3DEM datasets
| 3DEM dataset (EMDB) | EMD-50218 |
| Resolution: | 27.30 Å |
| Recommended level: | 0.600 |
| Estimated volume: | 775.95 nm³ |
Map projections ?
Orthogonal projection ?
Only data for the representative model is shown Only data for the representative model is shown

|

|

|
| X | Y | Z |
Orthogonal standard-deviation projections (false-colour) ?
Only data for the representative model is shown

|

|

|
| X | Y | Z |
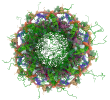
Orthogonal surface views (at contour level: 0.600 ?
Only data for the representative model is shown

|

|

|
| X | Y | Z |
Map analysis ?
This section contains the results of statistical analysis of the map.Map-value distribution ?
The map-value distribution is plotted in 128 intervals along the x-axis. The y-axis is logarithmic. A spike in this graph at zero usually indicates that the volume has been masked.
Volume estimate ?
Rotationally averaged power spectrum ?
*Reported resolution corresponds to spatial frequency of 0.037 Å⁻¹
Fourier-Shell correlation ?
FSC ?
*Reported resolution corresponds to spatial frequency of 0.037 Å⁻¹