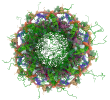
Fit of model(s) to crosslinking-MS data
Restraint types
Restraint types are summarized in the table below. Restraints assigned "by-residue" are interpreted as between CA atoms. Restraints between coarse-grained beads are indicated as "coarse-grained". Restraint group represents a set of crosslinking restraints applied collectively in the modeling.
There are 2336 crosslinking restraints combined in 231 restraint groups.
| Linker | Residue 1 | Atom 1 | Residue 2 | Atom 2 | Restraint type | Distance, Å | Count |
|---|---|---|---|---|---|---|---|
| sulfo-SDA | GLU | CA | LYS | CA | upper bound | 22.0 | 80 |
| sulfo-SDA | LYS | CA | SER | CA | upper bound | 22.0 | 16 |
| sulfo-SDA | GLU | CA | SER | CA | upper bound | 22.0 | 40 |
| sulfo-SDA | HIS | CA | LYS | CA | upper bound | 22.0 | 12 |
| sulfo-SDA | LYS | CA | THR | CA | upper bound | 22.0 | 16 |
| sulfo-SDA | HIS | CA | SER | CA | upper bound | 22.0 | 16 |
| sulfo-SDA | LEU | CA | LYS | CA | upper bound | 22.0 | 60 |
| sulfo-SDA | LYS | CA | MET | CA | upper bound | 22.0 | 8 |
| sulfo-SDA | MET | CA | SER | CA | upper bound | 22.0 | 4 |
| sulfo-SDA | LYS | CA | VAL | CA | upper bound | 22.0 | 48 |
| sulfo-SDA | GLN | CA | SER | CA | upper bound | 22.0 | 16 |
| sulfo-SDA | ILE | CA | LYS | CA | upper bound | 22.0 | 20 |
| sulfo-SDA | LYS | CA | PHE | CA | upper bound | 22.0 | 8 |
| sulfo-SDA | LYS | CA | LYS | CA | upper bound | 22.0 | 8 |
| sulfo-SDA | GLN | CA | LYS | CA | upper bound | 22.0 | 8 |
| sulfo-SDA | SER | CA | SER | CA | upper bound | 22.0 | 16 |
| sulfo-SDA | SER | CA | VAL | CA | upper bound | 22.0 | 16 |
| sulfo-SDA | ASP | CA | SER | CA | upper bound | 22.0 | 16 |
| sulfo-SDA | ASP | CA | LYS | CA | upper bound | 22.0 | 8 |
| sulfo-SDA | ARG | CA | SER | CA | upper bound | 22.0 | 32 |
| sulfo-SDA | CYS | CA | LYS | CA | upper bound | 22.0 | 8 |
| EDC | GLU | CA | LYS | CA | upper bound | 22.0 | 1264 |
| EDC | ASP | CA | LYS | CA | upper bound | 22.0 | 208 |
| EDC | ASP | CA | SER | CA | upper bound | 22.0 | 56 |
| EDC | ASP | CA | TYR | CA | upper bound | 22.0 | 16 |
| EDC | GLU | CA | SER | CA | upper bound | 22.0 | 216 |
| EDC | GLU | CA | THR | CA | upper bound | 22.0 | 32 |
| EDC | ASN | CA | LYS | CA | upper bound | 22.0 | 36 |
| EDC | LYS | CA | PRO | CA | upper bound | 22.0 | 12 |
| EDC | ARG | CA | SER | CA | upper bound | 22.0 | 16 |
| EDC | ASP | CA | THR | CA | upper bound | 22.0 | 8 |
| EDC | SER | CA | SER | CA | upper bound | 22.0 | 16 |
Distograms of individual restraints
Restraints with identical thresholds are grouped into one plot. Only the best distance per restraint per model group/ensemble is plotted. Inter- and intramolecular (including self-links) restraints are also grouped into one plot. Distance for a restraint between coarse-grained beads is calculated as a minimal distance between shells; if beads intersect, the distance will be reported as 0.0. A bead with the highest available resolution for a given residue is used for the assessment.
Satisfaction of restraints
Satisfaction of restraints is calculated on a restraint group (a set of crosslinking restraints applied collectively in the modeling) level. Satisfaction of a restraint group depends on satisfaction of individual restraints in the group and the conditionality (all/any). A restraint group is considered satisfied, if the condition was met in at least one model of the model group/ensemble. The number of measured restraints can be smaller than the total number of restraint groups if crosslinks involve non-modeled residues. Only deposited models are used for validation right now.
| State group | State | Model group | # of Deposited models/Total | Restraint group type | Satisfied (%) | Violated (%) | Count (Total=231) |
|---|---|---|---|---|---|---|---|
| 1 | 1 | 1 | 1/1 | All | 82.05 | 17.95 | 117 |
| Heteromeric links/ Intermolecular |
74.07 | 25.93 | 54 | ||||
| Self-links/ Ambiguous |
88.89 | 11.11 | 63 |
Per-model satisfaction rates in model groups/ensembles
Every point represents one model in a model group/ensemble. Where possible, boxplots with quartile marks are also plotted.
