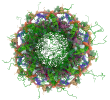
5.1. SAS ?
Model fits displayed in this section are obtained from SASBDB.
5.1.1. Model versus Experimental Scattering Profiles ?
Experimental (blue) and model (red) scattering profiles are presented as log I(q) vs. q together with error weighted residual difference plot between the experimental and model I(q) vs q. The I(q) is the intensity (preferably in absolute units of cm-1 or arbitrary units) and q is the modulus of the scattering vector. For a good fit, residual values should be equally and randomly spaced around the horizontal axis largely within +/- three standard deviations.
5.1.2. Χ² Goodness of Fit Assessment and 5.1.3. CorMap Test ?
χ² values are a measure of the overall fit of the model to the 1D scattering profile. A model that fits the data within its error estimates will have a χ² value close to one, provided that the dominant errors are the random statistical errors (i.e. no systematic errors) from the SAS measurement that are correctly propagated. Correlation Map (CorMap) test is a variance-covariance analysis on the scattering intensities comparing two (or more) scattering profiles (e.g. model versus experiment or multiple measures from the same sample). The CorMap test complements χ² and importantly is independent of the reported errors. The method assigns a probability (P-value based on a 1-tailed Schilling test) for finding the longest string of experimental data points that lie systematically above (+1) or below (-1) the model profile. The P-value lies between 0 – 1 and a significance threshold is chosen below which the model fit is judged to show systematic deviation from experiment. A typical range statisticians use to indicate significant deviation is 0.01 - 0.05. As implemented in the ATSAS suite, the reported CorMap P-value is green (model fit is good) for P > 0.05, yellow for 0.01 < P < 0.05, and red (model deviates significantly) for P < 0.01.
| SASDB ID | Model | χ² | P-value |
|---|---|---|---|
|
SASDDD6
|
1
|
2.95
|
0.00
|
