5.3. 3DEM
This section describes fit of models to the 3DEM data. Only results for the representative model, selected as a first model with the largest number of asymmetric units.
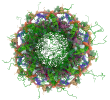
EMD-10661
5.3.1. Map-model fit ?
Only results for the representative Model 1 are shown.5.3.1.1 Map-model overlay ?

|

|

|
| X | Y | Z |
The images above show the 3D surface view of the map at the recommended contour level 0.052 at 50% transparency in yellow overlaid with a ribbon representation of the model colored in blue. These images allow for the visual assessment of the quality of fit between the atomic model and the map.
5.3.1.2. Q-score mapped to coordinate model ?

|

|

|

|
| X | Y | Z |
The images above show the model with each residue colored according to its Q-score. This shows their resolvability in the map with higher Q-score values reflecting better resolvability. Please note: Q-score is calculating the resolvability of atoms, and thus high values are only expected at resolutions at which atoms can be resolved. Low Q-score values may therefore be expected for many entries.
5.3.1.3. Atom inclusion mapped to coordinate model ?

|

|

|

|
| X | Y | Z |
The images above show the model with each residue colored according to its atom inclusion. This shows to what extent they are inside the map at the recommended contour level 0.052 .
5.3.1.4. Atom inclusion ?
At the recommended contour level, 90% of all backbone atoms, 90% of all non-hydrogen atoms, are inside the map.
5.3.1.5. Map-model fit summary ?
The table lists the average atom inclusion at the recommended contour level ( 0.052 ) and Q-score for the entire model and for each chain.
| Chain | Atom inclusion | Q-score |
|---|---|---|
| All | 0.900 | 0.029 |
| A1 | 0.998 | 0.046 |
| B1 | 0.921 | 0.025 |
| D1 | 0.845 | 0.016 |
| K1 | 0.838 | 0.035 |
| L1 | 0.960 | 0.041 |
| M1 | 0.978 | 0.044 |
| N1 | 0.978 | 0.020 |
| O1 | 0.985 | 0.028 |
| P1 | 1.000 | 0.032 |
| R1 | 0.735 | 0.020 |